Do Vampires REALLY Exist?

They own the darkness, feeding on the blood of the innocent. Vampires!!
Legends as compelling and disquieting today as in their origins, vampire lore
continues to influence and inspire the creative vision of writers and artists,
but what do you really know about vampires?
From movies, books and TV shows you probably know such "facts"
as:
- vampires only come out at night,
- they sleep in coffins,
- they can turn into bats,
- they live forever,
- they drink blood to survive and
- you become a vampire if you are bitten by one.
BUT, DO THEY REALLY EXIST?
You can now use a spreadsheet and some simple formulae to prove once and
for all if vampires really exist.
Below are some assumptions we need to make if this exercise to function
properly:
|
ASSUMPTIONS
- One vampire does exist.
- That a vampire must suck one person's blood each week to survive.
- Once a person is bitten by a vampire, he or she becomes a vampire.
|
 |
Task Description: Is
a spreadsheet powerful enough to keep vampires away? Find out as you build
it. What you discover may be shocking!
Step A
Bites Per Week
What to do: Create an Excel worksheet to
fill in statistics through Week 8, using the following basic steps.
- On your worksheet, type in the headings and statistics for Week 0 as shown
below. Now type in stats for Week 1 (1 person bitten, 2 vampires now exist)
and Week 2 (2 more people bitten, 4 vamps on the prowl). You should now fill
in the rest. If there were 4 vampires at the end of Week 2, how
many people would get bitten in Week 3? (4) And how many vampires would that
make, total? (8)
- How many people would those vampires bite in Week 4,
creating how many more of their kind?
- You get the idea now. Carry it through to the end of
Week 8. How many bloodsuckers do you end up with? (256)
Step B
Graph Those Vamps!
WHAT TO DO:
- Select your data in Column C, go to Insert, and
choose Chart. Using Chart Wizard, select a type of chart that shows data
over time. The chart below is one example. Click Finish.
- Move your chart to the right side of your worksheet,
so you can look at it side-by-side with your data.
Create a graph to get a vivid picture of
the vampire population boom.
What kind of trend does your chart show? Where might the
pattern go from here?
Print out your data sheet and your chart to have on hand for
the next step.
Step CStep
C
Formula, Bloody Formula
WHAT TO DO: Now you're going to get the
spreadsheet to
count seven more months worth of vampires for you -- in mere minutes!
- Look again at your statistics through week 8. In math terms, what is the
relationship between vampires at the end of one week and the number of
people bitten the next?
- Here's another way of looking at it: What pattern do you see from week to
week in the number of people bitten? What about the week-to-week vampire
numbers?
- Create a formula for Columns B and C in Week 9 (that's
cell B11 and C11, respectively) that will extend the pattern of Weeks 0-8.
- Implement your formula, and check to be sure that the pattern continues.
- Now you can use Excel's AutoFill feature to complete your worksheet. For
Column A, highlight cells A9 and A10, point to the "handle" in the
lower right corner of A10, and drag it through A37.
- Now fill in Column B by using AutoFill to drag the formula through week 35
(cell B37). Fill Column C by dragging the formula in C10 down through C37.
- Format your vampire stats by selecting Columns B and C, going to Format,
choosing Cells, and selecting Numbers on the list. Type in 0 decimal places,
and select Use 1000 Separator. Save your work.
- How many vamps are there at the end of Week 35? If your formulas are
correct, you should show 34,359,738,368. Say that number out loud: 34
billion, 359 million, 738 thousand, 368. That's a lot of living dead!
|
Here are a few links to Halloween and Vampire pages
you might find interesting to look at
|
 |
S
Step Dtep
D
Vampire Reality Check
WHAT TO DO: So how does your vampire
census match up against the actual world population? Here's how to find out.
Check your worldwide vampire
census against the real thing.
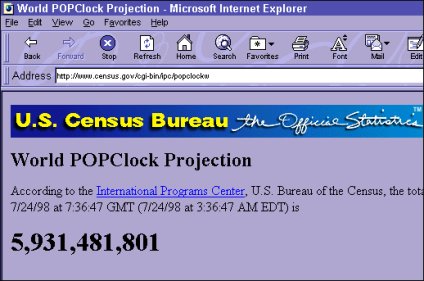
- Launch Internet Explorer, and go to http://www.census.gov/cgi-bin/ipc/popclockw
the U.S. Census Bureau's World POPClock. This gives an
up-to-the-second projected count of the world's human population, based on
actual numbers plus estimated births and deaths.
- What number is showing in bold type? It should be about six billion, give
or take a few million. Select and copy this number, go back to your Excel worksheet,
and paste it into cell C38.
- In cell D38, type in the label People on Earth.
- Save and print your sheet.
- Now think about your findings. According to your
spreadsheet, how many of the world's people are actually vampires?
(Every single one of them -- and then some!) At which point in your chart
did the entire population of Planet Earth become vampirized? (Between Weeks
32 and 33.) Could this possibly be true? Congrats! You have just constructed
what mathematicians call a "proof by contradiction."
- Just for fun, copy your data sheet, paste it in a new worksheet, and start
with three vampires instead of just one. Enter values manually for the first
few weeks, then create a formula to extend the pattern. How long does it
take vampires to take over the world in this scenario?